

A good Facebook Ads CTR in 2026 is generally one that performs competitively for your specific industry, campaign objective, audience, and placement rather than simply exceeding a universal percentage.
For a useful benchmark, WordStream’s latest widely cited Facebook dataset reports an average 1.71% CTR for traffic campaigns and 2.59% for lead campaigns. Traffic CTR ranged from 0.80% to 4.13% across the industries covered, showing how strongly industry affects performance.
If your CTR is below your relevant benchmark, investigate the creative, audience, offer, placement, and campaign objective before assuming the ad itself is failing. A higher CTR is not automatically better if the clicks do not produce qualified leads, purchases, or profitable customers.
This guide explains the latest useful Facebook Ads CTR benchmarks by industry, how the benchmarks differ by objective, what counts as a good CTR, why your CTR may be high or low, and how to improve it without optimizing for clicks at the expense of conversions.
What Is Facebook Ads CTR?
Facebook Ads CTR, or click-through rate, measures how frequently people click an ad after seeing it.
The basic calculation is:
CTR = Clicks ÷ Impressions × 100
For example, if an ad receives 150 clicks from 10,000 impressions:
150 ÷ 10,000 × 100 = 1.5% CTR
A 1.5% CTR therefore means that approximately 1.5 out of every 100 impressions generated a click.
However, advertisers need to pay attention to which CTR metric they are using.
A campaign can report different click-related metrics, including clicks associated with the ad generally, link clicks, and outbound clicks. These metrics answer different questions and should not automatically be treated as interchangeable.
For performance benchmarking, use the metric that matches the benchmark dataset you are comparing against.
This distinction is especially important because an all-click CTR and a link-click CTR can produce substantially different percentages for the same campaign.
What Is a Good Facebook Ads CTR in 2026?
There is no single CTR percentage that should be considered universally good.
A practical starting point is to compare your campaign with a benchmark that matches its objective and industry.
WordStream’s 2025 Facebook Ads benchmark found an average 1.71% CTR for traffic campaigns across the industries studied. For lead-generation campaigns, the overall average was 2.59%.
Another 2026 analysis of Meta advertising data reported an overall 1.49% CTR across a different sample, while other 2026 benchmark reports publish industry ranges rather than one average.
The difference is not necessarily a contradiction. Benchmark datasets can use different:
- Campaign objectives
- CTR definitions
- Industries
- Geographic markets
- Account sizes
- Time periods
- Placement mixes
- Audience types
- Data sources
- Statistical methods
Therefore, advertisers should use benchmarks as diagnostic reference points, not guaranteed performance targets.
Facebook Ads CTR Benchmarks by Industry in 2026
The following table uses the latest widely cited WordStream/LocaliQ Facebook benchmark data for traffic campaigns. These figures are particularly useful because they provide industry-level comparisons rather than relying on one overall average. The underlying dataset covers U.S. campaigns, so the figures should not be presented as universal global averages.
| Industry | Traffic Campaign CTR |
|---|---|
| Shopping, Collectibles & Gifts | 4.13% |
| Travel | 2.76% |
| Sports & Recreation | 2.60% |
| Arts & Entertainment | 2.10% |
| Beauty & Personal Care | 1.81% |
| Attorneys & Legal Services | 1.76% |
| Personal Services | 1.70% |
| Real Estate | 1.68% |
| Restaurants & Food | 1.67% |
| Animals & Pets | 1.64% |
| Health & Fitness | 1.63% |
| Automotive — For Sale | 1.48% |
| Education & Instruction | 1.45% |
| Furniture | 1.39% |
| Business Services | 1.38% |
| Industrial & Commercial | 1.36% |
| Apparel, Fashion & Jewelry | 1.29% |
| Home & Home Improvement | 1.28% |
| Finance & Insurance | 0.98% |
| Physicians & Surgeons | 0.83% |
| Automotive — Repair, Service & Parts | 0.80% |
| All industries | 1.71% |
The large spread matters. The highest reported traffic CTR in this dataset was 4.13% for Shopping, Collectibles & Gifts, while Automotive Repair, Service & Parts was 0.80%.
That means comparing every Facebook campaign against the overall 1.71% figure can produce misleading conclusions.
What Are the Best Facebook Ad CTR Benchmarks by Industry?
There is no single “best” industry CTR because the objective and campaign context matter.
However, the available benchmark data provides a useful ranking of industries.
Shopping, Collectibles & Gifts
Shopping, Collectibles & Gifts recorded the highest traffic CTR in the WordStream dataset at 4.13%.
Consumer products can benefit from visually compelling creative, recognizable products, discounts, promotions, and relatively straightforward purchase intent.
A retailer should not automatically expect 4.13%, however. Product category, price, brand awareness, offer strength, audience temperature, and creative quality can move CTR significantly.
Travel
Travel recorded a 2.76% traffic CTR, placing it among the stronger-performing categories in the dataset.
Travel advertising naturally lends itself to visual storytelling. Destinations, experiences, seasonal offers, hotels, flights, and vacation packages can provide strong reasons for users to investigate an offer.
Sports & Recreation
Sports & Recreation recorded a 2.60% traffic CTR.
Interest-driven categories can benefit from highly engaged audiences. Creative that demonstrates the experience, product, activity, or desired outcome can be particularly effective.
Arts & Entertainment
Arts & Entertainment recorded 2.10% for traffic campaigns and an even higher 3.92% in the benchmark’s lead-generation dataset.
The difference illustrates why advertisers should never compare traffic and lead campaign CTRs without considering the objective.
Beauty & Personal Care
Beauty & Personal Care recorded 1.81% for traffic campaigns and 2.55% for lead campaigns in the WordStream data.
Visual demonstrations, product benefits, tutorials, before-and-after concepts, creator-style content, and strong product positioning can all influence click behavior.
Legal Services
Attorneys & Legal Services recorded 1.76% traffic CTR and 2.11% lead CTR in the benchmark data.
Legal advertising often involves higher-consideration decisions. The most important metric may therefore be qualified lead generation rather than CTR alone.
Real Estate
Real Estate recorded 1.68% traffic CTR but 3.75% lead CTR in the benchmark.
This is a useful example of how campaign objective can change the benchmark substantially.
For property advertisers, a slightly lower CTR can still be commercially successful if the traffic produces qualified inquiries, property viewings, or completed applications.
Finance & Insurance
Finance & Insurance recorded 0.98% traffic CTR.
This lower CTR does not automatically indicate ineffective advertising. Financial products can involve greater trust requirements, regulatory considerations, complex offers, and longer decision cycles.
Advertisers in this category should evaluate CTR alongside qualified leads, approval rates, customer acquisition costs, and revenue.
Why Do Facebook Ads CTR Benchmarks Differ by Industry?
Industry influences CTR because users behave differently depending on the product, purchase intent, emotional appeal, price, perceived risk, and complexity of the decision.
A person may click immediately on a travel destination that interests them but hesitate before clicking an advertisement for insurance or professional services.
The major factors include:
- Product appeal
- Purchase consideration
- Price
- Brand familiarity
- Audience intent
- Offer strength
- Visual appeal
- Trust requirements
- Buying cycle
- Market competition
- Creative format
- Landing-page expectation
- Audience targeting
- Geographic market
The benchmark should therefore be treated as a contextual comparison, not a pass/fail score.
Why Are Facebook Advertising Networks Important?
Facebook advertising is part of Meta’s wider advertising ecosystem, and Facebook remains an important paid-social channel for businesses attempting to reach targeted audiences.
For advertisers, the value of Facebook advertising is not simply the number of impressions generated.
A successful campaign needs to connect:
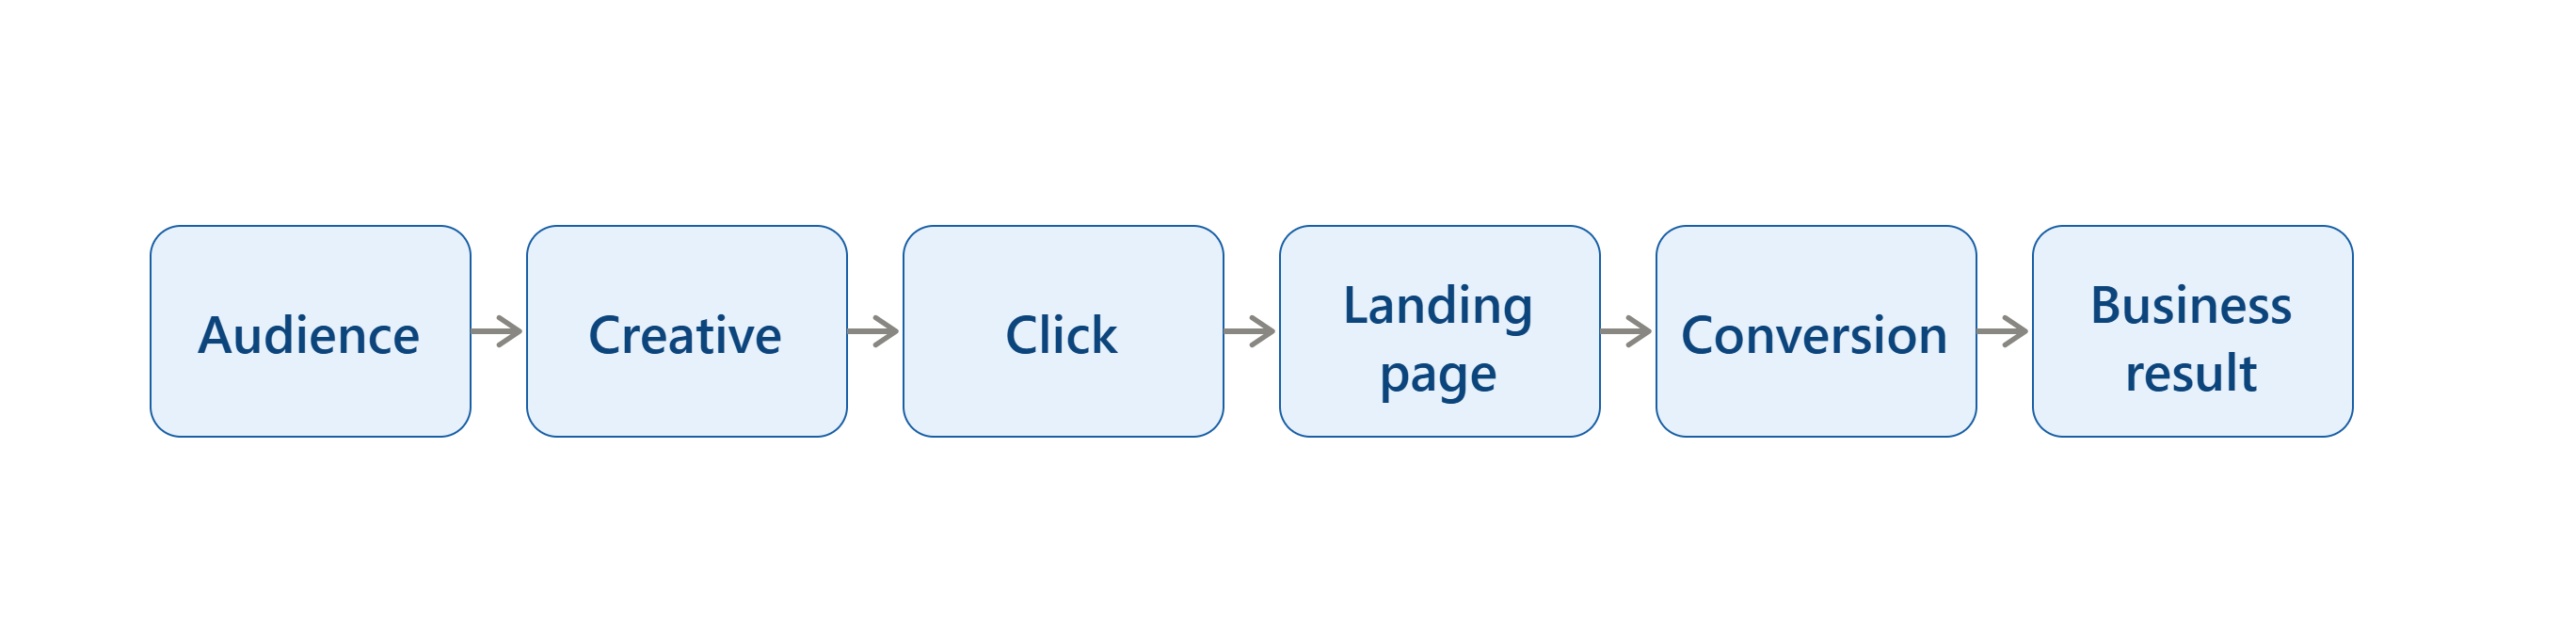
CTR measures only one part of that chain.
A high CTR can be valuable when it indicates that the creative and audience are aligned. But if those clicks fail to convert, the campaign may still be unprofitable.
Likewise, a lower CTR can sometimes be acceptable if the ad attracts highly qualified prospects who convert at a strong rate.
How Do Facebook Ads Work for Advertisers?
A Facebook advertising campaign generally involves selecting a business goal, defining the audience and delivery settings, creating the ad, and allowing Meta’s advertising system to deliver the ad to eligible users.
The advertiser then evaluates performance using metrics such as:
- Impressions
- Reach
- CTR
- Link clicks
- CPC
- CPM
- Conversions
- Conversion rate
- Cost per result
- ROAS
The important relationship is:
- CTR tells you about click engagement.
- Conversion rate tells you what happens after the click.
- CPA tells you what the conversion costs.
- ROAS tells you whether advertising revenue justifies spend for revenue-based campaigns.
Looking at these metrics together provides a much better picture than CTR alone.
Facebook Traffic CTR vs. Lead CTR
One of the most important findings from current benchmark research is that traffic and lead-generation campaigns should not be benchmarked against the same number.
WordStream reported:
| Campaign Type | Overall CTR |
|---|---|
| Traffic campaigns | 1.71% |
| Lead campaigns | 2.59% |
These figures come from different campaign objectives in the same benchmark research.
Lead campaigns also showed significant industry variation.
| Industry | Lead Campaign CTR |
|---|---|
| Arts & Entertainment | 3.92% |
| Real Estate | 3.75% |
| Sports & Recreation | 3.41% |
| Physicians & Surgeons | 3.02% |
| Restaurants & Food | 2.97% |
| Career & Employment | 2.81% |
| Beauty & Personal Care | 2.55% |
| Attorneys & Legal Services | 2.11% |
| Industrial & Commercial | 2.08% |
| Personal Services | 1.99% |
| Home & Home Improvement | 1.94% |
| Education & Instruction | 1.86% |
| Health & Fitness | 1.72% |
| Furniture | 1.48% |
| Dentists & Dental Services | 1.05% |
Source: WordStream/LocaliQ 2025 Facebook Ads benchmark data.
How to Calculate Facebook Ads CTR
You can calculate CTR manually using:
CTR = Clicks ÷ Impressions × 100
For example:
- Impressions: 50,000
- Clicks: 750
CTR:
750 ÷ 50,000 × 100 = 1.5%
A 1.5% result should then be compared with the correct benchmark.
If your campaign is a traffic campaign for a business category near the overall benchmark, 1.5% may be close to the broad reference point.
But if you operate in an industry where the benchmark is substantially higher or lower, the interpretation changes.
The same calculation also illustrates why sample size matters. An ad with 10 clicks from 500 impressions has a 2% CTR, but that result is less stable than a campaign generating thousands of impressions and clicks.
How to Benchmark Your Facebook Ads CTR Correctly
Step 1 — Identify the Campaign Objective
First determine whether the campaign is primarily designed for:
- Traffic
- Leads
- Sales
- Engagement
- App promotion
- Another business outcome
Do not compare a lead campaign directly with a traffic benchmark without qualification.
Step 2 — Identify the Correct CTR Metric
Confirm whether your benchmark uses:
- All-click CTR
- Link CTR
- Outbound CTR
- Another click-related metric
Use the same definition on both sides of the comparison.
Step 3 — Match Your Industry
Choose the closest available industry benchmark.
If your business does not fit neatly into one category, select the closest category based on what the advertisement is actually promoting.
Step 4 — Check Your Geography
Geography can influence advertising performance because:
- audience size
- purchasing power
- competition
- language
- seasonal behavior
- advertising
costs differ between markets.
The WordStream/LocaliQ benchmark cited above is based on U.S. campaigns.Do not describe those figures as exact worldwide averages.
Step 5 — Segment by Audience
Compare cold audiences separately from:
- Retargeting audiences
- Website visitors
- Existing customers
- Engaged users
- Lookalike audiences
A warm audience can behave very differently from someone encountering the brand for the first time.
Step 6 — Examine Placement
CTR can differ across:
- Facebook Feed
- Stories
- Reels
- Other placements
Do not assume that one placement’s performance represents the entire account.
Step 7 — Evaluate Conversions
Finally, ask:
Did the clicks produce the desired business outcome?
This is the step that prevents CTR optimization from becoming a vanity-metric exercise.
What Is a Good CTR for Facebook Ads?
As a practical interpretation, a campaign around the relevant industry benchmark can be considered broadly competitive, while a materially higher or lower result deserves investigation.
However, “good” should ultimately be defined by profitability and business outcomes.
For example:
Campaign A
- CTR: 3.0%
- CPC: $0.40
- Conversion rate: 0.3%
- Very low-quality leads
Campaign B
- CTR: 1.2%
- CPC: $1.20
- Conversion rate: 8%
- Highly qualified customers
Campaign A has the higher CTR, but Campaign B could be much more valuable to the business.
Therefore:
High CTR ≠ automatically successful campaign.
A better evaluation is:
CTR + CPC + Conversion Rate + CPA/ROAS + Lead Quality
Why Is My Facebook Ads CTR Low?
A low CTR usually indicates that the audience is not sufficiently motivated to click, the creative does not communicate the value quickly enough, or the targeting and offer are poorly aligned.
Common causes include:
Weak Creative
The ad may fail to attract attention or communicate a clear benefit.
Poor Audience Fit
The advertisement may be reaching people who are unlikely to need the product or service.
Weak Offer
Even strong creative cannot compensate for an unattractive offer.
Generic Messaging
Messages that could apply to any competitor often give users little reason to click.
Poor Creative-to-Audience Match
A professional B2B audience may respond differently to an ad than a consumer entertainment audience.
Unclear Call to Action
Users should understand what happens after clicking.
Creative Fatigue
An ad that performed well initially may decline as the same audience sees it repeatedly.
Wrong Benchmark
Sometimes the campaign is not actually underperforming; the advertiser is simply comparing it against an inappropriate benchmark.
How to Improve Facebook Ads CTR
Improve the First Visual Impression
Your first image or video frame should make the advertisement immediately understandable.
Avoid making users decode the advertisement before they know what is being offered.
Make the Value Proposition Specific
Instead of:
“Improve Your Business Today”
use a message that communicates a concrete benefit, audience, or outcome.
For example:
“Generate More Qualified Leads Without Increasing Your Daily Ad Budget”
The second message gives users a clearer reason to investigate.
Strengthen the Offer
Test different:
- Discounts
- Bundles
- Free trials
- Demonstrations
- Guides
- Consultations
- Limited-time offers
- Product benefits
The appropriate offer depends on the industry and customer journey.
Test Multiple Creative Concepts
Do not change only the headline repeatedly.
Test different:
- Hooks
- Images
- Videos
- Opening frames
- Offers
- Calls to action
- Value propositions
- Social proof
- Formats
This helps determine whether the problem is creative concept rather than minor copy wording.
Improve Audience Relevance
A highly relevant advertisement can outperform a more visually impressive advertisement shown to the wrong audience.
Review:
- Audience definition
- Geographic targeting
- Demographics
- Interests where applicable
- Retargeting
- Customer segments
- Exclusions
Align the Landing Page
The experience should remain consistent:
Ad promise → Landing page message → Offer → Conversion action
If the advertisement promises one thing and the landing page presents another, clicks may not translate into meaningful results.
What Causes a High Facebook Ads CTR?
A high CTR can result from several positive factors:
- Strong creative
- Highly relevant audience
- Compelling offer
- Clear value proposition
- Strong brand recognition
- Effective CTA
- Timely promotion
- Retargeting
- High-interest subject matter
- Strong visual appeal
But a high CTR can also occur for the wrong reasons.
For example, sensational or misleading creative may generate many clicks while producing poor-quality traffic.
This is why advertisers should always inspect post-click behavior.
Should You Optimize Facebook Ads Only for CTR?
No.
CTR is useful, but optimizing solely for CTR can produce the wrong incentives.
If the goal is sales, a campaign with a slightly lower CTR but much stronger conversion rate may outperform a high-CTR campaign.
- For lead generation, lead quality matters.
- For ecommerce, purchases, revenue, CPA, and ROAS matter.
- For SaaS, qualified trials, pipeline, customer acquisition cost, and revenue may matter more than clicks.
CTR should therefore be treated as a diagnostic metric within the funnel, not the final business objective.
Facebook Ads CTR vs. CPC
- CTR and CPC are related but measure different things.
- CTR measures click frequency relative to impressions.
- CPC measures the average amount paid for clicks.
A campaign can have a relatively high CTR and still have expensive clicks because advertising costs depend on more than click frequency.
WordStream’s 2025 traffic campaign benchmark reported an overall Facebook Ads CPC of $0.70, but Finance & Insurance had a much higher average CPC of $1.22, while Shopping, Collectibles & Gifts was at $0.34.
This reinforces the importance of comparing multiple metrics rather than judging campaigns from CTR alone.
Facebook Ads CTR vs. Conversion Rate
CTR answers:
“Did people click?”
Conversion rate answers:
“Did those visitors take the desired action?”
Imagine two campaigns:
| Metric | Campaign A | Campaign B |
|---|---|---|
| CTR | 2.5% | 1.4% |
| Conversion Rate | 1% | 6% |
| Traffic Quality | Moderate | High |
| Business Outcome | Weak | Strong |
Campaign A has a better CTR but Campaign B may generate substantially more customers.
This is why a strong Facebook advertising strategy optimizes the entire funnel rather than one metric.
How to Troubleshoot a Low Facebook Ads CTR
| Problem | Possible Cause | Solution |
|---|---|---|
| CTR suddenly falls | Creative fatigue | Introduce new creative concepts |
| CTR is low from launch | Weak audience or message | Reassess targeting and value proposition |
| CTR is high but conversions are low | Landing-page mismatch | Align the landing page with the ad |
| CTR varies heavily by placement | Creative does not fit all formats | Create placement-specific creative |
| CTR is high but leads are poor | Misleading or overly broad message | Improve qualification and offer clarity |
| Retargeting CTR falls | Audience saturation | Refresh creative or adjust audience windows |
| One ad performs far better | Creative variation is stronger | Analyze its hook, format, and offer |
| CTR looks good but CPA is poor | Weak post-click conversion | Improve landing page or conversion flow |
| CTR is below benchmark | Wrong benchmark | Match objective, industry, metric, and geography |
Troubleshooting should begin with the largest likely source of performance loss rather than changing everything simultaneously.
What Should You Do If CTR Is Below Your Industry Benchmark?
Do not immediately increase the budget.
Instead, follow this sequence:
1. Confirm the metric.
Make sure you are comparing the same CTR definition.
2. Confirm the campaign objective.
Do not compare traffic CTR with an unrelated lead-generation benchmark.
3. Check audience relevance.
Determine whether the ad is reaching the people most likely to need the offer.
4. Review the creative.
Look at the first visual, headline, offer, CTA, and overall message.
5. Compare placements.
Identify whether one placement is responsible for the weak average.
6. Check frequency and fatigue.
A declining CTR after strong initial performance may indicate audience saturation.
7. Review downstream performance.
Determine whether a low CTR is actually hurting business results.
8. Test one major variable at a time where practical.
This makes performance changes easier to interpret.
What If Your CTR Is Much Higher Than the Benchmark?
A significantly higher CTR can be a positive signal, but it should still be investigated.
Ask:
- Are the clicks relevant?
- Are users converting?
- Is the landing page working?
- Is CPC efficient?
- Is the campaign generating qualified leads?
- Is the audience unusually warm?
- Is the ad attracting accidental clicks?
- Is the creative making a promise that the landing page fulfills?
If CTR is high and downstream performance is strong, you may have found an effective combination of audience, creative, and offer.
If CTR is high but conversions are poor, the advertisement may be generating curiosity rather than buying intent.
How Industry Affects What Counts as a Good CTR
A useful way to interpret the benchmark table is to group industries by the type of buying behavior they often involve.
High-Interest Consumer Categories
Examples include:
- Travel
- Entertainment
- Sports
- Consumer products
- Beauty
These categories can benefit from visual and emotional appeal.
High-Consideration Services
Examples include:
- Legal
- Healthcare
- Finance
- Real estate
- Professional services
Users may require more trust and information before clicking or converting.
2026 Facebook Ads CTR Benchmark Ranges
Recent 2026 benchmark reports provide additional directional context.
One 2026 analysis based on more than $48 million in Meta ad spend reported these CTR figures across selected industries:
| Industry | 2026 CTR |
|---|---|
| E-commerce / Retail | 1.59% |
| Travel & Hospitality | 1.78% |
| Fitness & Wellness | 1.52% |
| Education | 1.42% |
| Home Services | 1.31% |
| Real Estate | 1.08% |
| Healthcare | 0.91% |
| Automotive | 0.96% |
| SaaS / Technology | 0.94% |
| Legal Services | 0.82% |
| Finance & Insurance | 0.73% |
The same analysis reported an overall 1.49% CTR across its sample.
These figures should be treated as another directional benchmark, not combined mathematically with the WordStream figures. The samples, methodologies, time periods, and industry definitions differ.
Why 2026 Benchmark Sources Show Different Numbers
It is normal to find different Facebook CTR benchmarks online.
For example, current sources may report overall averages around 1%–2% while another dataset reports a substantially different result.
This happens because “Facebook CTR” can refer to different measurements.
Differences can come from:
- All clicks vs. link clicks
- Traffic vs. leads campaigns
- Facebook-only vs. broader Meta placements
- U.S. vs. global campaigns
- Ecommerce-only samples vs. mixed industries
- Median vs. mean
- Different reporting periods
- Different account sizes
- Different audience mixes
Therefore, the best practice is not to find the largest or smallest benchmark and use it as your target.
Instead, find the most comparable benchmark.
A Better Facebook Ads Benchmarking Framework
Use this five-level framework:
Level 1 — Metric
What exact CTR are you measuring?
Level 2 — Objective
What is the campaign designed to achieve?
Level 3 — Industry
What type of product or service is being advertised?
Level 4 — Audience
Is the audience cold, warm, retargeted, or existing?
Level 5 — Business Outcome
Are clicks producing valuable conversions?
This creates a more meaningful comparison than simply asking whether CTR is above 1% or 2%.
Facebook Ads CTR Benchmark Decision Framework
Use this simplified decision process:
Is your CTR below the relevant benchmark?
→ Yes
Check the metric → objective → audience → creative → placement → offer.
→ No
Check conversion rate and business results.
Is CTR high but conversions poor?
→ Investigate landing page, offer, audience quality, and post-click experience.
Is CTR low but conversions strong?
→ Do not automatically change the campaign. The traffic may be highly qualified.
Are both CTR and conversions weak?
→ Reassess the campaign’s audience, creative, offer, landing page, and positioning.
This prevents advertisers from making optimization decisions based on one number.
Expert Insights for Improving Facebook Ads CTR in 2026
Benchmark Against Your Own Historical Performance
Industry benchmarks are useful, but your own account can provide an even more relevant comparison.
If your normal CTR is 1.8% and a new creative produces 2.4% while maintaining conversion quality, that improvement may be more meaningful than whether the campaign exceeds an external industry average.
Separate Creative Problems From Audience Problems
A weak CTR does not necessarily mean the creative is bad.
If multiple creative concepts underperform against the same audience, targeting may be the bigger issue.
If one audience performs well across multiple creatives while another does not, audience quality deserves more attention.
Do Not Chase the Highest Possible CTR
The goal is not to create the ad that receives the most clicks.
The goal is to create the ad that generates valuable actions from the right users at an economically sustainable cost.
Common Facebook Ads CTR Mistakes
Mistake 1 — Using One Global CTR Target
Why it happens: One simple percentage is easier to communicate.
Why it matters: Industry and objective can materially change CTR.
Correct approach: Use a matched benchmark.
Mistake 2 — Comparing Different CTR Definitions
Why it happens: Reporting dashboards contain multiple click metrics.
Why it matters: The percentages may not measure the same behavior.
Correct approach: Match the metric used by your benchmark.
Mistake 3 — Comparing Traffic and Lead Campaigns
Why it happens: Both campaigns display a CTR percentage.
Why it matters: Different objectives can produce different performance patterns.
Correct approach: Compare like with like.
Mistake 4 — Optimizing Only for CTR
Why it happens: CTR is easy to understand and measure.
Why it matters: Clicks do not necessarily generate revenue or qualified leads.
Correct approach: Evaluate CTR alongside conversion and financial metrics.
Mistake 5 — Ignoring Geography
Why it happens: International advertisers may use U.S. benchmarks because they are widely available.
Why it matters: Market conditions differ.
Correct approach: Clearly label U.S. data and use local historical data whenever available.
Mistake 6 — Changing Everything at Once
Why it happens: Advertisers want rapid improvement.
Why it matters: You cannot identify what caused the performance change.
Correct approach: Use controlled creative, audience, offer, or landing-page tests wherever practical.
Frequently Asked Questions
What is the average Facebook Ads CTR in 2026?
There is no single universally applicable 2026 average. WordStream’s latest widely cited benchmark reports 1.71% for traffic campaigns and 2.59% for lead campaigns across the industries included in its U.S. dataset. Other 2026 datasets report different averages because they use different samples and methodologies.
Is a 1% CTR good on Facebook Ads?
A 1% CTR can be acceptable in some industries and weak in others. For example, the WordStream traffic benchmark reports 0.98% for Finance & Insurance, while Shopping, Collectibles & Gifts is 4.13%.
Is 2% CTR good for Facebook Ads?
A 2% CTR can be strong for some industries and campaigns, but whether it is good depends on the objective, metric, audience, placement, and conversion performance.
What is a good CTR for Facebook lead ads?
WordStream’s 2025 benchmark reports an overall lead-campaign CTR of 2.59%. However, industry results range from 1.05% for Dentists & Dental Services to 3.92% for Arts & Entertainment in the reported dataset.
What industry has the highest Facebook Ads CTR?
In the WordStream traffic campaign dataset, Shopping, Collectibles & Gifts had the highest reported CTR at 4.13%.
What industry has the lowest Facebook Ads CTR?
Among the listed traffic campaign categories, Automotive — Repair, Service & Parts had the lowest reported CTR at 0.80%, followed by Physicians & Surgeons at 0.83%.
Why is my Facebook CTR lower than the industry average?
Possible reasons include weak creative, poor audience fit, a weak offer, creative fatigue, placement differences, geographic differences, or comparing your campaign with an incompatible benchmark.
Why is my Facebook CTR high but my sales are low?
A high CTR only shows that people are clicking. Poor sales can result from weak landing-page conversion, incorrect audience targeting, poor offer quality, pricing, technical problems, or low-intent traffic.
Should I increase my Facebook Ads budget if CTR is high?
Not automatically. Before increasing budget, confirm that conversions, CPA, ROAS, and lead quality remain acceptable. A high CTR alone does not prove that scaling will be profitable.
Should Facebook Ads CTR be compared with Google Ads CTR?
Not directly. The platforms have different user behavior, intent, auction environments, placements, and campaign structures. Use platform-specific benchmarks whenever possible.
Is Facebook Ads CTR the same as Meta Ads CTR?
Not necessarily. Meta’s advertising ecosystem includes Facebook, Instagram, and other placements. A benchmark may refer specifically to Facebook or to broader Meta advertising. Always check what placements and metrics are included in the source.
How often should Facebook Ads CTR be checked?
CTR can be monitored regularly, but meaningful decisions should use enough data to avoid reacting to normal short-term fluctuations. The appropriate observation period depends on spend, impressions, audience size, campaign duration, and conversion volume.
What is more important than CTR?
The answer depends on the campaign goal, but conversion rate, cost per acquisition, revenue, ROAS, and customer or lead quality can be more important than CTR for evaluating business success.
Read More:
Final Takeaway
Facebook Ads CTR benchmarks are useful only when they are interpreted in context.
The latest widely cited WordStream/LocaliQ benchmark reports 1.71% average CTR for traffic campaigns and 2.59% for lead campaigns, but individual industries vary dramatically. Traffic CTR ranges from 0.80% for Automotive Repair, Service & Parts to 4.13% for Shopping, Collectibles & Gifts in the reported dataset.
The most important lesson is therefore not to chase one “perfect” CTR.
Instead, benchmark your campaign against the closest combination of:
Industry + Objective + CTR Definition + Geography + Audience + Placement
Then evaluate CTR alongside CPC, conversion rate, CPA, ROAS, and customer or lead quality.
A Facebook ad with a slightly below-average CTR can be an excellent campaign if it generates profitable customers. Conversely, an advertisement with an exceptional CTR can be a poor campaign if those clicks do not produce meaningful business results.
For 2026, use external benchmarks to identify potential performance gaps, but use your own historical account data and downstream business results to determine what “good” actually means for your campaign.